ESGデータ
環境報告(エネルギー使用状況)
環境データ Environmental Data
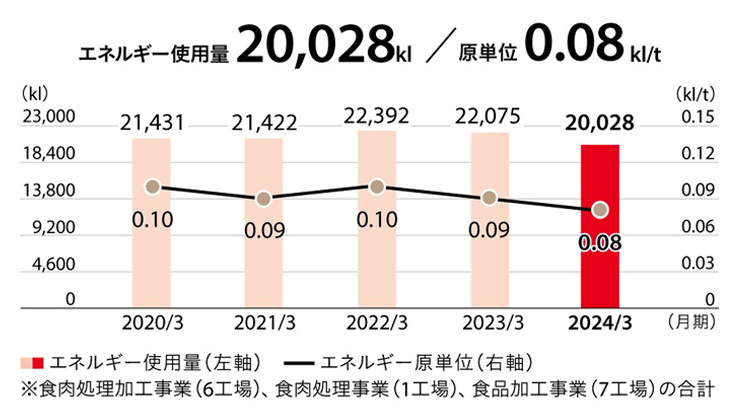
| エネルギー使用量(原油換算) Energy Consumption (Crude oil equivalent) |
2023年度 FY2023 |
2024年度 FY2024 |
2025年度 FY2025 |
単位 unit |
|---|---|---|---|---|
| A重油 Heavy fuel oil A |
933 | 859 | 509 | kl |
| LPG Liquefied Petroleum Gas/LPG |
1,348 | 1,309 | 1,325 | kl |
| 灯油 Kerosene |
996 | 963 | 929 | kl |
| LNG Liquefied Natural Gas/LNG |
1,151 | 1,161 | 1,177 | kl |
| 都市ガス Town gas |
3,324 | 3,214 | 3,553 | kl |
| 電力 Electricity |
12,276 | 12,397 | 12,636 | kl |
| エネルギー原単位 Energy consumption intensity |
0.0898 | 0.1110 | 0.0962 | kl/t |
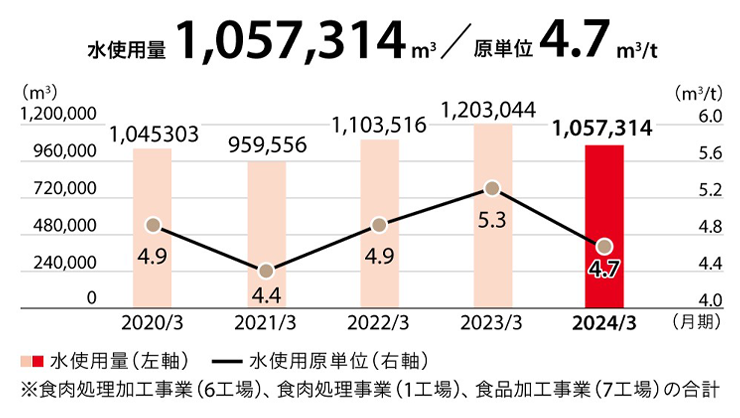
| 水使用量 Water Consumption |
2023年度 FY2023 |
2024年度 FY2024 |
2025年度 FY2025 |
単位 unit |
| 水道 Tap water |
773,484 | 800,750 | 816,916 | ㎥ |
| 井水 Well water |
283,830 | 482,491 | 514,879 | ㎥ |
| 水使用原単位 Water consumption intensity |
4.74 | 6.80 | 6.35 | ㎥/t |
※ 食肉処理加工事業(6工場)、食肉処理事業(1工場)、食品加工事業(7工場)の合計
エネルギー使用量/原単位 Energy consumption/intensity
水使用量/原単位 Water Consumption/intensity
社会性報告
従業員の概要 Overview of employees
| 従業員の概要 Overview of employees |
2023年度 FY2023 |
2024年度 FY2024 |
2025年度 FY2025 |
|---|---|---|---|
| 総従業員数(人) Number of employees |
1,650 | 1,726 | 1,749 |
| 年代別従業員数内訳 Breakdown of employees by age |
|||
| 30歳未満(人) Number of employees Under 30s |
311 | 331 | 345 |
| 30歳代~50歳代(人) Number of employees 30s to 50s |
1,165 | 1,196 | 1,204 |
| 60歳代以上(人) Number of employees 60s and over |
174 | 199 | 200 |
| 正社員数(人) Number of regular employees |
1,298 | 1,355 | 1,355 |
| 男性正社員(人) Male (regular employees) |
1,085 | 1,123 | 1,113 |
| 女性正社員(人) Female (regular employees) |
213 | 232 | 257 |
| 女性正社員比率(%) Percentage of female employees (%) (regular employees) |
16.4 | 17.1 | 18.9 |
| 年代別正社員数内訳 Breakdown of regular employees by age |
|||
| 30歳未満(人) Number of regular employees Under 30s |
295 | 339 | 295 |
| 30歳代~50歳代(人) Number of regular employees 30s to 50s |
1,003 | 1,016 | 1,074 |
| 有期契約社員数(人) Fixed-term employee |
352 | 371 | 379 |
| 男性有期契約社員数(人) Fixed-term employee (Male) |
229 | 251 | 279 |
| 女性有期契約社員数(人) Fixed-term employee (Female) |
123 | 120 | 100 |
| 年代別有期契約社員数内訳 Breakdown of fixed-term employee by age |
|||
| 30歳未満(人) Number of Fixed-term employees Under 30s |
16 | 26 | 50 |
| 30歳代~50歳代(人) Number of Fixed-term employees 30s to 50s |
162 | 146 | 130 |
| 60歳代以上(人) Number of Fixed-term employees 60s and over |
174 | 199 | 199 |
| 平均年齢(歳) Average age |
40.2 | 40.4 | 40.3 |
| 男性(歳) Male (age) |
40.7 | 40.7 | 40.7 |
| 女性(歳) Female (age) |
37.7 | 38.8 | 38.7 |
| 平均勤続年数(年) Average duration of employment (years) |
14 | 13.4 | 13.5 |
| 男性(年) Average duration of employment for male (year) |
14.8 | 14.1 | 14.3 |
| 女性(年) Average duration of employment for female(year) |
10 | 10.1 | 9.9 |
| 管理職者数(人) Number of managers |
257 | 263 | 263 |
| 男性管理職者数(人) Number of male managers |
244 | 250 | 248 |
| 女性管理職者数(人) Number of female managers |
13 | 13 | 15 |
| 女性管理職比率(%) Percentage of female managers (%) |
5.1 | 4.9 | 5.7 |
| 平均給与(千円) Average salary (Thousand yen) |
6,364 | 6,648 | 6,783 |
| 男性(千円) Average salary for male (Thousand yen) |
6,763 | 6,948 | 7,130 |
| 女性(千円) Average salary for female (Thousand yen) |
5,010 | 5,149 | 5,222 |
| 新卒採用人数(人) Number of new graduates hired |
48 | 51 | 51 |
| 男性(人) Number of new graduates hired for male |
42 | 40 | 40 |
| 女性(人) Number of new graduates hired for female |
6 | 11 | 11 |
| 中途採用者数(人) Number of mid-career employee |
37 | 57 | 66 |
| 男性(人) Male |
30 | 44 | 38 |
| 女性(人) Female |
7 | 13 | 28 |
| 離職率(%) Turnover rate (%) |
6.9 | 6.0 | 7.0 |
| 自己都合退職率(%) Voluntary retirement rate (%) |
4.4 | 4.6 | 5.9 |
ダイバーシティ Diversity
| 障がい者雇用者数 Employment status of persons with disabilities |
2023年度 FY2023 |
2024年度 FY2024 |
2025年度 FY2025 |
|---|---|---|---|
| 雇用率(%)※1 Percentage of employees with disabilities (%) |
1.9 | 1.9 | 1.7 |
※1 障害者雇用制度に基づき算定(障害者雇用制度に基づく雇用率:2.2%)
Calculated based on Disabled Persons Act / Disabled Persons Act requires employers to keep the rate of hiring personnel disabilities over 2.2%
| 定年退職後の再雇用状況 Status of Re-Employment Following Mandatory Retirement |
2023年度 FY2023 |
2024年度 FY2024 |
2025年度 FY2025 |
|---|---|---|---|
| 定年退職者数(人) Number of mandatory retirees |
22 | 23 | 30 |
| (内)再雇用者数(人) Breakdown of Number of re-employed retirees |
17 | 20 | 26 |
| 再雇用率(%) Re-employment rate(%) |
77.3 | 87.0 | 86.6 |
| 育児関連制度 Child Care-Related Systems |
2023年度 FY2023 |
2024年度 FY2024 |
2025年度 FY2025 |
|---|---|---|---|
| 育児休業取得者数(人) Number of childcare leave takers |
32 | 26 | 30 |
| (内)男性育児休業取得者数(人)※2 Breakdown of Number of childcare leave takers for male |
22 | 19 | 21 |
| 育児休業取得後の復職率(%)※3 Rate of employees returning to work (%) |
94 | 83 | 100 |
| 育児短時間勤務取得者数(人)※4 Shortened working hours for childcare (number of users) |
24 | 18 | 30 |
※2 男性の育児休業取得には、育児休業等のほか、育児目的休暇も含む。
Childcare leave taken by eligible male employees includes childcare leave as well as other leave for the purpose of childcare.
※3 育児目的休暇のみ取得の場合は、育児休業取得後の復職率には含めない。
Employees who take only leave for childcare purposes are excluded from the return-to-work rate after childcare leave.
※4 育児短時間勤務は子が小学校4学年の始期に達するまで1日の所定労働時間を2時間以内で短縮することができる。
Until an employee's child completes three years of elementary school, the employee's scheduled working hours can be reduced by up to two hours.
健康および労働安全衛生
Employee Health and Occupational Health & Safety
| 健康と安全の管理 Management of employee health and safety |
2023年度 FY2023 |
2024年度 FY2024 |
2025年度 FY2025 |
|---|---|---|---|
| 定期健康診断受診率(%) Consultation rate of regular health checkup (%) |
100.0 | 100.0 | 100.0 |
| ストレスチェック実施率(%) Implementing rate of job stress check (%) |
97.0 | 98.0 | 98.0 |
| 労働災害発生件数(件)※5 Number of Occupational Accidents |
14 | 15 | 17 |
| 労働災害度数率(%)※6 Frequency Rate of Occupational Accidents |
3.8 | 4.0 | 4.5 |
| 労働災害強度率(%)※7 Lost-time injury severity rate |
0.06 | 0.04 | 0.05 |
※5 労働災害発生件数:休業1日以上の労働災害発生件数、但し通勤災害は除く。
Number of occupational accidents resulting in absence of at least one day, excluding commuting accidents.
※6 労働災害度数率:度数率は、100万延べ実労働時間当たりの労働災害による死傷者数をもって、労働災害の頻度を表すもの。
Frequency rate of occupational accidents : the number of casualties due to occupational accidents per million hours of actual work, as an indication of the frequency of accidents.
※7 労働災害強度率:強度率は、1,000延べ実労働時間当たりの延べ労働損失日数をもって、災害の重さの程度を表したもの。
Lost-time injury severity rate:total work days of lost time per 1,000 actual working hours and the severity of accidents.
| 労働時間と年次有給休暇 Status of Working Hours and Use of Annual Paid Leave |
2023年度 FY2023 |
2024年度 FY2024 |
2025年度 FY2025 |
|---|---|---|---|
| 年間総労働時間数(時間) Annual actual working hours |
2,251 | 2,253 | 2,122 |
| 有給休暇平均取得日数(日) Average number of days of annual paid leave taken |
9.8 | 10.0 | 10.2 |
| 有給休暇平均付与日数(日) Average number of days of annual paid leave granted |
18.0 | 18.4 | 18.1 |
| 有給休暇平均取得率(%) Average usage rate of annual paid leave (%) |
54.3 | 54.2 | 56.7 |
※全データの適用範囲:スターゼン株式会社単体
Scope of application of all data : Starzen Co., Ltd., non-consolidated
※各年度基準日:3月31日
Base date for each year : 31st March